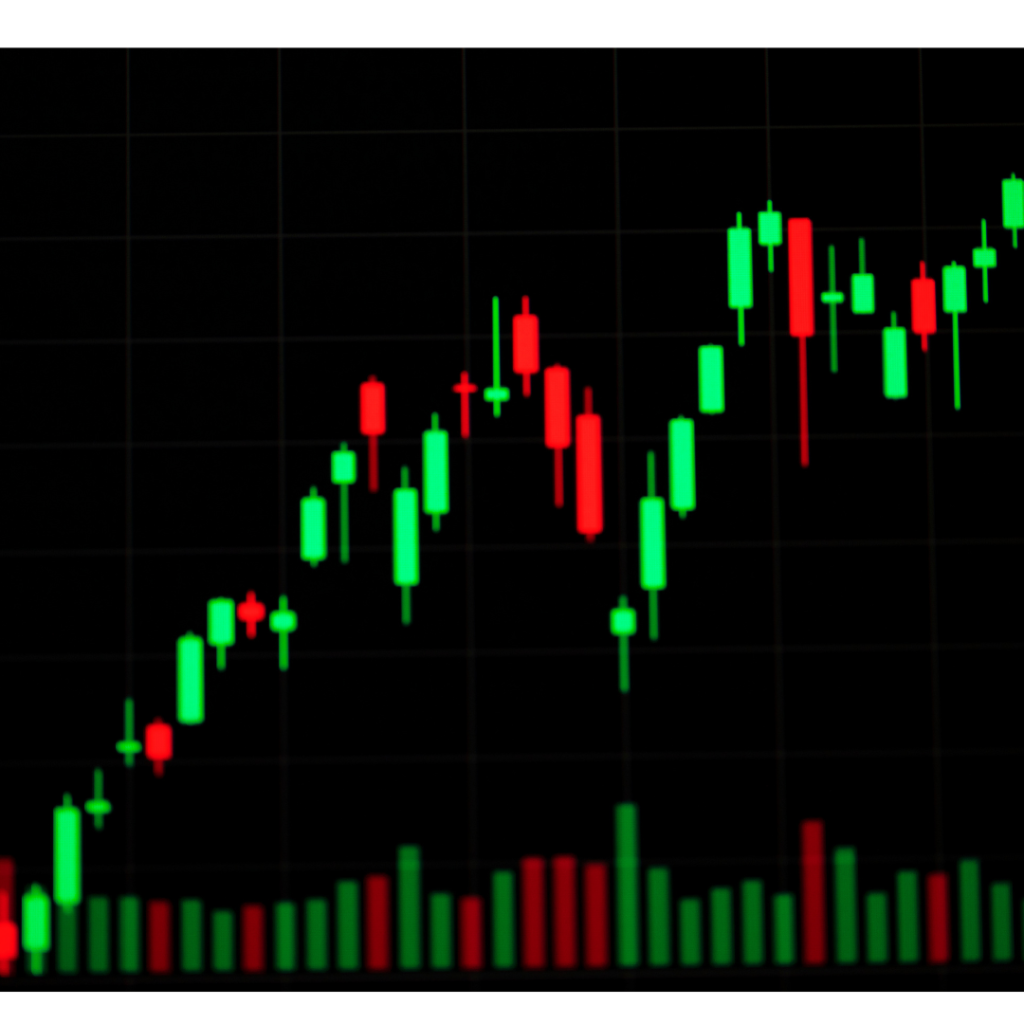
In the dynamic world of financial markets, understanding various types of charts is crucial for making informed decisions. Among these, the candlestick chart stands out due to its comprehensive and insightful representation of price movements. But is it really important to understand the candlestick chart? In this blog post, we will delve into the details of candlestick charts and explore why they are so valuable for traders and investors.
What is a Candlestick Chart?
A candlestick chart is a financial tool that illustrates the price movements of assets such as securities, derivatives, or currencies.Each ‘candlestick’ represents one period of data (e.g., one day, one hour), with the body of the candlestick showing the opening and closing prices, and the wicks (or shadows) indicating the highest and lowest prices within that period. This method of charting originated in Japan over 200 years ago, and has become a fundamental tool in technical analysis.

Components of a Candlestick
1. The Body:
- Bullish Candlestick: When the closing price exceeds the opening price, the body is typically shaded green or white.
- Bearish Candlestick: When the closing price falls below the opening price, the body is usually shaded red or black.
2. The Wick:
- Upper Wick: Represents the highest price reached during the period.
- Lower Wick: Represents the lowest price reached during the period.
By understanding these components, traders can gain insights into the market sentiment during a specific timeframe.
Importance of Using a Candlestick Chart
1. Visual Representation of Price Movements
One of the primary benefits of a candlestick chart is its ability to provide a visual representation of price movements. Unlike line charts, which only show closing prices, candlestick charts give a more detailed view of how prices moved within each period. This visual clarity helps traders quickly understand the market’s behavior and make quick decisions.
2. Identification of Market Trends
Candlestick charts are instrumental in identifying market trends. By analyzing the patterns formed by candlesticks, traders can determine whether the market is in an uptrend, downtrend, or sideways trend. Recognizing these trends is crucial for planning trades and investments effectively.
3. Reversal and Continuation Patterns
Candlestick charts are renowned for their patterns that indicate potential market reversals or continuations. Here are a few key patterns:
- Doji: Indicates indecision in the market, where the opening and closing prices are nearly the same.
- Engulfing Patterns: Bullish Engulfing signifies a potential upward reversal, while Bearish Engulfing signifies a potential downward reversal.
- Morning Star and Evening Star: Morning Star indicates a bullish reversal, while Evening Star indicates a bearish reversal.
Grasping these patterns enables traders to forecast potential price movements and modify their strategies as needed.
4. Support and Resistance Levels
Candlestick charts help in identifying support and resistance levels, which are key price points where the market tends to reverse or consolidate. These levels are crucial for setting entry and exit points in trades. For instance, if a stock price repeatedly bounces back from a certain level, that level can be considered a strong support.
5. Market Sentiment Analysis
Candlestick patterns convey the underlying market sentiment. For example, a long bullish candlestick signifies strong buying pressure, indicating a positive market sentiment. Conversely, a long bearish candlestick suggests strong selling pressure. By interpreting these patterns, traders can gauge the market’s mood and adjust their trades accordingly.
6. Enhanced Risk Management
Effective risk management is critical for successful trading. Candlestick charts aid in setting more accurate stop-loss and take-profit levels. For instance, placing a stop-loss below a strong support level identified through candlestick patterns can help minimize losses in a market downturn.
Improving Trading Strategies with Candlestick Charts
Combining with Other Indicators
While candlestick charts are powerful on their own, combining them with other technical indicators like moving averages, RSI (Relative Strength Index), or MACD (Moving Average Convergence Divergence) can enhance the accuracy of your analysis. This integrated approach helps confirm signals and provides a more holistic view of the market.
Practice and Experience
Mastering candlestick charts requires practice and experience. Utilizing demo accounts to practice identifying and trading based on candlestick patterns can be immensely beneficial. This practice helps in recognizing patterns more quickly and accurately in real trading scenarios.
Conclusion
In the fast-paced world of trading and investing, understanding candlestick charts is not just important—it is essential. These charts provide a detailed visual representation of price movements, help in identifying market trends, reveal key patterns, and enhance risk management.
Whether you are a novice trader or a seasoned investor, incorporating candlestick charts into your analytical toolkit can lead to more informed and strategic decision-making. By dedicating time to learn and master these charts, you set yourself up for greater success in navigating the complexities of financial markets.


